
Predictive Curve Reading of a Magnetostrictive Displacement Sensor: Spotting Degradation in Position Data
A magnetostrictive displacement sensor does not only output a number; its curve is the history of how the cylinder moved. Predictive maintenance in displacement measurement has a premise that is often overlooked: degradation that is to be predicted must first be observable. The value of position data is that it is a direct record of the actuator's action — internal cylinder leakage, guide-way wear, seal ageing and proportional-valve drift all leave traces on "the position curve under the same command". The trend in industry is that predictive maintenance is expanding from "single-point vibration/temperature monitoring" to "comparison of motion-process data". These sensors output absolute position, measure without contact and introduce no wear of their own, so they are well suited to serving as this kind of long-term baseline data source. Be clear, though: position data can indicate signs of degradation; it does not directly give remaining life. Any claim that displacement data can predict the exact time of failure should be treated with caution.
What position data can observe
Taking the position–time curve of a complete motion as the observation object, extractable features usually include: time to target, steady-state position error, position drift during pressure hold, repeatability of a round-trip stroke, and stick-slip jitter in the start-up section. These features are relatively stable when the machine is healthy and drift slowly as it degrades. The key is the baseline: a set of reference curves must first be captured while the machine is in good condition. All later judgements are relative comparisons, not absolute thresholds. A slow fall of holding pressure at mid-stroke and a longer closing time point to internal leakage; rising lag at reversal points to valve drift.
Common signs of degradation and how they appear in position data
| Appearance in the position data | Possible degradation direction | Suggested corroboration |
|---|---|---|
| Position drifts slowly in one direction during pressure hold | Internal cylinder leakage, reversing-valve internal leak, accumulator failure | Compare with the pressure curve; run a pressure-hold drop test |
| Time to target lengthens cycle by cycle | Falling pump flow, oil contamination, clogged filter | Check oil cleanliness and filter differential pressure |
| Scatter of the return reading at the same set-point increases | Growing mechanical backlash, a loose magnet, valve zero drift | Rule out installation and the sensor side first, then the mechanics |
| Periodic jitter in the low-speed section | Insufficient guide-way lubrication, stick-slip, growing proportional-valve hysteresis | Low-speed round-trip tests; compare different speed bands |
| Occasional jumps in the reading, not gradual | Usually electrical/communications, not mechanical degradation | Locate item by item per the troubleshooting flow |
The last row is especially important: a step change is not degradation. Gradual change indicates a wear trend; a jump usually points to earthing, shielding, the magnet or the fieldbus. Handle that first per the signal-jump troubleshooting flow and fieldbus data loss: termination / address conflicts / water ingress, or an electrical fault will be misread as mechanical degradation and trigger a useless overhaul.
Three hard constraints on the data-acquisition side
- Time base: curve comparison depends on time alignment. Analog sampled through a PLC scan has timestamp accuracy limited by the scan cycle; fieldbus types (especially EtherCAT with distributed clocks) can provide a more stable sampling beat; see EtherCAT real-time performance: DC synchronisation and jitter.
- Update-rate matching: if the interest is low-speed stick-slip or pressure-hold drift, the update-rate demand is modest; if shock-section features are to be captured, confirm that the update rate matches the control cycle; see matching response time / refresh rate to the control cycle.
- Comparability of figures: typical repeatability of ±0.002 mm and typical non-linearity of <0.02%FS are the capability boundary on the sensor side. If the degradation magnitude to be monitored is close to or smaller than that boundary, the observed "trend" may only be measurement noise; see the difference among resolution, repeatability and non-linearity.
From data to a maintenance action: layered judgement
| Layer | Judgement basis | Disposition | Implementation difficulty |
|---|---|---|---|
| L1 threshold alarm | Over-range, time-to-target timeout, position error out of limit | PLC alarms and stops directly | Low — logic is enough |
| L2 trend observation | Weekly/monthly moving-average shift of a key feature | Include in inspection; schedule planned maintenance | Medium — needs a historical archive |
| L3 curve comparison | Shape change of the whole position curve against the health baseline | Locate the specific part (valve / cylinder / mechanics) | Medium–high — needs edge compute |
| L4 multi-source fusion | Joint analysis of position + pressure + temperature + current | Distinguish different root causes of the same sign | High — involves cross-system data |
In real projects, L1 and L2 usually have the highest return on investment; L3/L4 suit high-value single machines whose downtime cost is large. Data layering and local processing architecture are in IIoT and edge computing: an architecture for getting position data to the cloud; the networking foundation is in how to network displacement sensors under Industry 4.0.
The sensor's own maintainability must also be considered
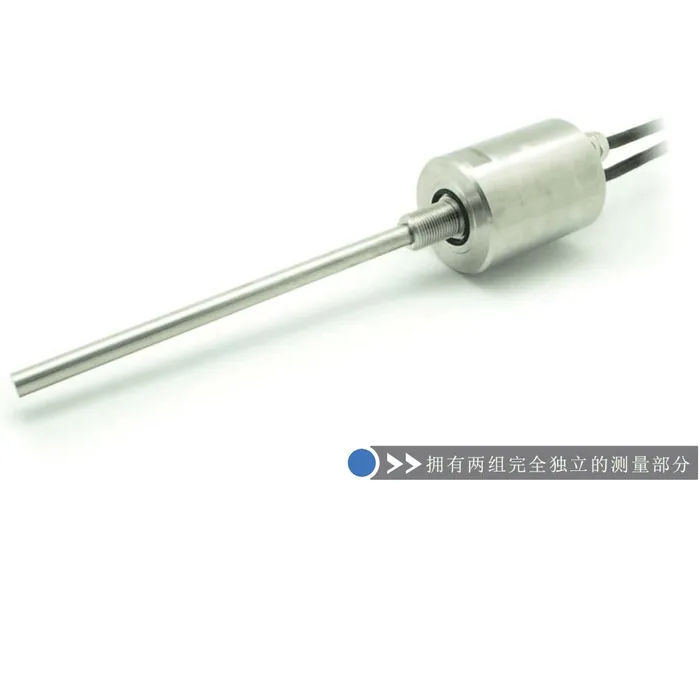
Predictive maintenance assumes that the data source itself is reliable. A magnetostrictive displacement sensor measures without contact; there is no mechanical contact between the position magnet and the waveguide, and none of the sliding wear of a contact-based sensor, which makes it suitable as a long-term baseline source. Cable, connector seals and mounting fasteners still age and must be watched. Smart sensors with diagnostic capability can report their own status; see smart sensors: the trend towards self-awareness through self-diagnostics. Where downtime cost is extremely high, dual-channel redundancy can provide mutual checking; see redundant output and dual-channel safety design and redundant installation: how to compare two sensors.
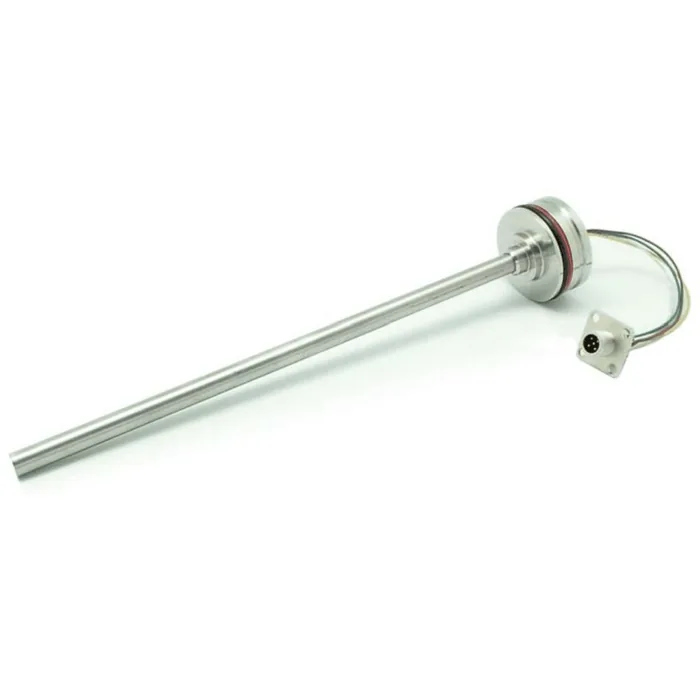
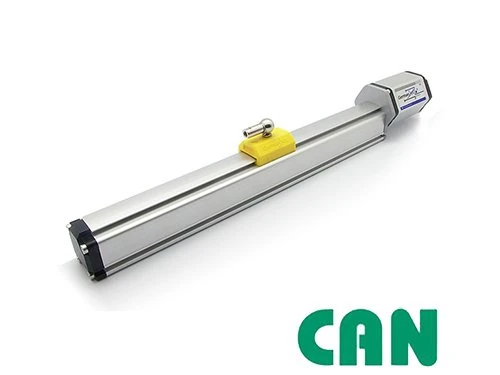
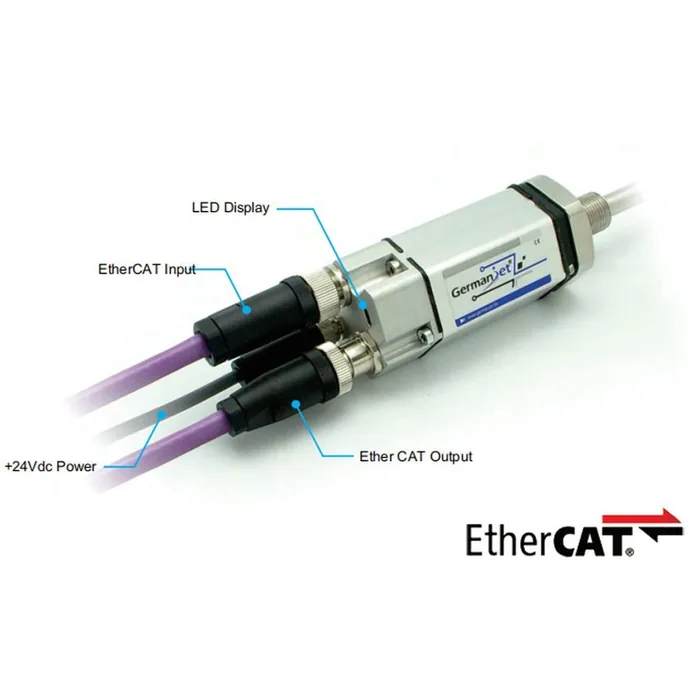
On the product side, the cylinder-integrated Series 16 and the redundant 16R redundant cylinder-integrated are common on hydraulic machines that need long-term on-line monitoring; mobile and outdoor duty more often uses the Series 13 mobile hydraulics; when fieldbus diagnostics and high-rate sampling are needed, choose the Series 197 EtherCAT or the Series 194 CANopen.
Frequently Asked Questions
Q: Can displacement data predict when a machine will fail?
Position data can indicate signs of degradation (for example growing pressure-hold drift or a lengthening time to target); it does not directly give remaining life. Any claim that displacement data can predict the exact time of failure should be treated with caution. The reasonable use is to build a health baseline, then compare relative trends and schedule planned maintenance.
Q: Does a jumping reading mean the machine is degrading?
Usually not. Gradual change indicates a wear trend; a sudden jump more often points to electrical and communications problems such as incorrect shield earthing, a missing terminating resistor, a loose magnet or water ingress. Locate the electrical side first per the troubleshooting flow, or interference will be misread as mechanical degradation and trigger a useless overhaul.
Q: What sensor figures does predictive maintenance require?
The key is that the degradation magnitude to be monitored must be clearly larger than the sensor's measurement-capability boundary. Typical repeatability is ±0.002 mm and typical non-linearity is <0.02%FS; if the drift of interest is close to that order, the observed trend may only be measurement noise. The resolution step must also match the observation target.
Q: When is the best time to capture baseline data?
On the day the machine passes acceptance. The condition is then closest to healthy. Capture and archive complete position curves of several typical motions; all later judgements use that as the reference. Building a baseline afterwards is essentially useless, because it cannot be confirmed whether the machine had already degraded.
Q: What does a slow drop of position during pressure hold indicate?
Common directions are internal cylinder leakage, reversing-valve internal leak or accumulator failure. Corroborate with a pressure-hold drop test against the pressure curve. Rule out the sensor and magnet installation first, then locate the specific hydraulic component.
Related Products
Related Applications
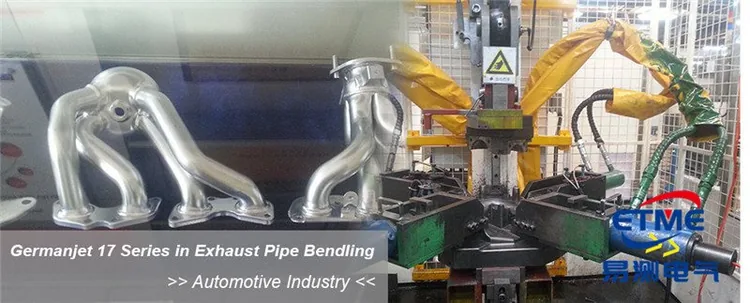
Series 16 Hydraulic Rod Magnetostrictive Displacement Sensor Application Cases
View Details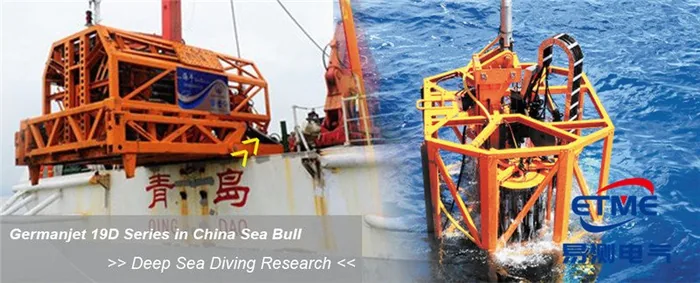
Series 19D Split-Type Process Displacement Sensor Application Cases
View Details
Series 19F Flexible Process Displacement Sensor Application Cases
View Details